keikiban
A PostgreSQL dashboard that stays up when the database does not.
When something is wrong at 3am, browsing a schema is not what I need. I need to know which query is eating the server, who is blocking whom, and whether that index nobody scanned in six months is worth its gigabyte.
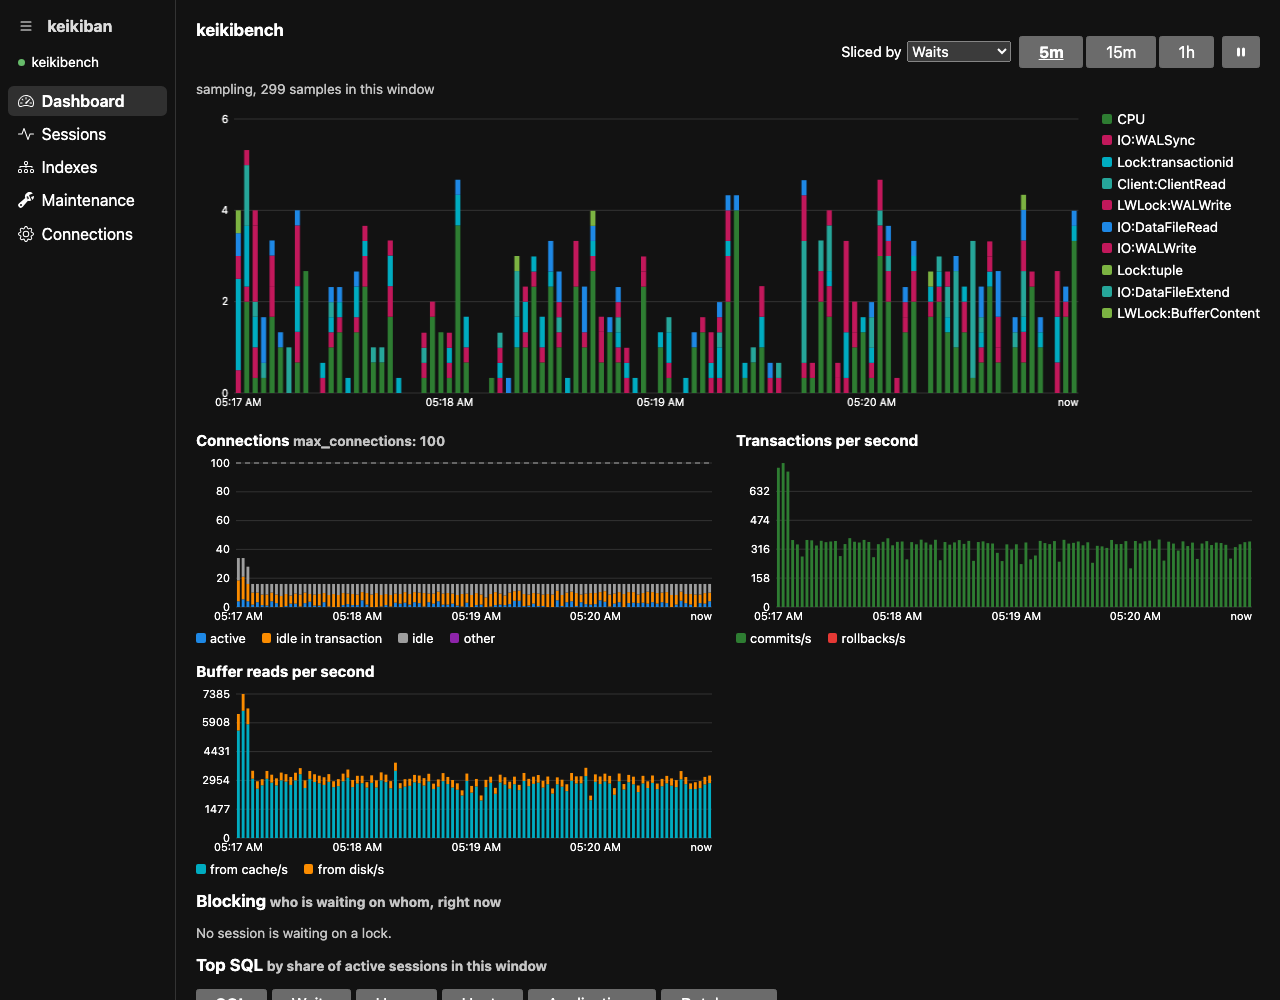
pg_stat_activity: no agent
on the server, no extension required. Every number on this page was
measured against a pgbench workload and recorded with
keikiban -json dashboard; nothing here is drawn from
made-up data.
What it shows
Load and top SQL
Average active sessions stacked by wait event, sliced by SQL, user,
host, application or database. Each statement in the ranking is
broken down by what it waited on. With
pg_stat_statements the ranking also carries calls/s,
rows/call and ms/call.
Blocking
Who holds the lock, who waits on it, the SQL on both sides, the lock mode, and how long the wait has been going. Chains are detected, so the middle link is labelled instead of being mistaken for the culprit.
Index health
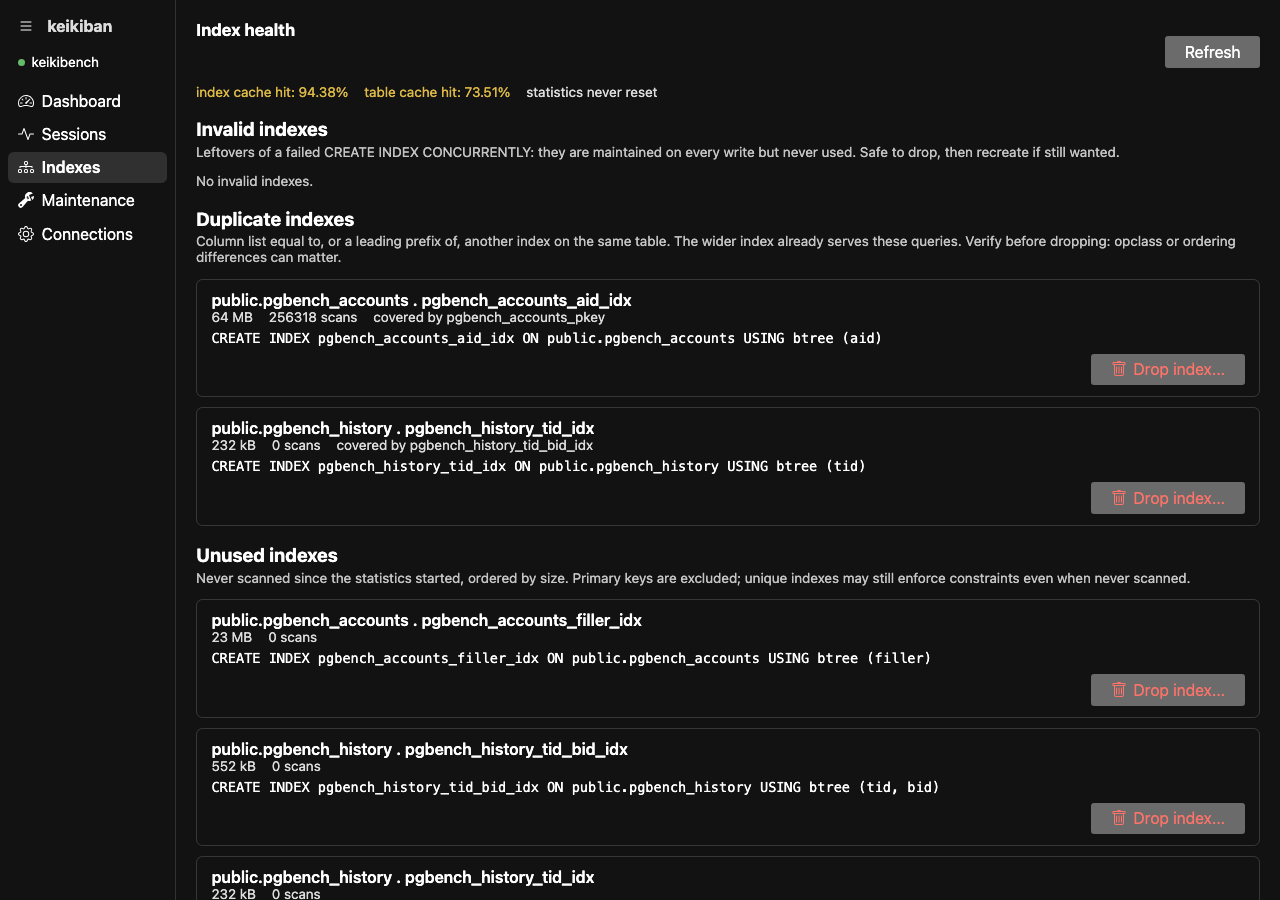
Unused, duplicate and invalid indexes, ordered by the space they waste. Sequential-scan offenders and cache hit ratios. Primary keys are never suggested for removal, and unique indexes carry a warning.
Maintenance
Transaction ID wraparound, dead rows and when vacuum last ran, long transactions holding vacuum back, and sequences approaching overflow.
Install
Requires PostgreSQL 12 or newer and a 64-bit machine. Nothing to install on the server.
brew install crgimenes/tap/keikiban
Or take a binary from the releases:
| System | File |
|---|---|
| macOS (Intel and Apple Silicon) | keikiban-darwin-universal.zip |
| Windows x64 / arm64 |
keikiban-windows-amd64.exe,
keikiban-windows-arm64.exe
|
| Linux x64 / arm64 |
keikiban-linux-amd64.gz,
keikiban-linux-arm64.gz
|
The macOS build is signed and notarized. Windows SmartScreen may want "More info" then "Run anyway".
Configure
Connections live in a
Filo file at
~/.config/keikiban/init.filo. On first run the app asks for
a connection and writes the file.
; keikiban configuration
(database "postgres://user:pass@db.internal:5432/app" "Production")
(database "postgres://user:pass@localhost:5432/app" "Local")
One connection at a time: connecting to one closes the other. The name of the attached database sits in the sidebar and in the window title, so a command cannot land on a server you were not looking at.
For agents
The GUI is the product. The flags exist so an AI agent can drive it:
keikiban -json dashboard 30    sample the load for 30s, then report it
keikiban -json sessions        current sessions
keikiban -json locks           blocking tree
keikiban -json indexes         index health report
keikiban -json maintenance     vacuum, wraparound, sequences
Each prints one JSON document to stdout and exits. Passwords are masked
everywhere, including in -debug.